Semantic rendering gallery#
This executable gallery combines the v0.5 semantic line, point, ribbon, scale, and guide APIs. The layers return ordinary Matplotlib artists and share trained mappings per axes. Automatic guides remain ordinary native legends and colorbars.
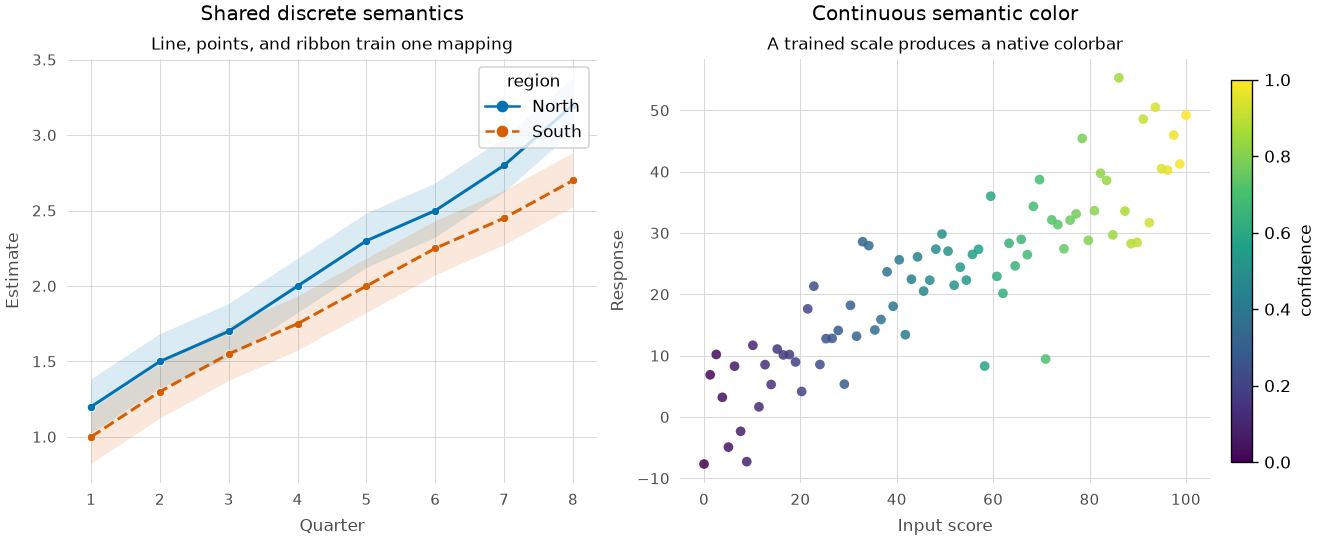
The result of every renderer also implements ggstyle.RenderedResult. Its
as_dict() and describe() methods provide bounded inspection data without
serializing live Matplotlib objects.
Executable source#
examples/semantic_gallery.py#
"""Generate the checked-source v0.5 semantic-rendering gallery."""

from __future__ import annotations

import argparse
from pathlib import Path

import matplotlib

matplotlib.use("Agg")
import matplotlib.pyplot as plt
import numpy as np
import pandas as pd
from matplotlib.figure import Figure

import ggstyle as gs


def semantic_figure() -> Figure:
    """Build native semantic layers with automatic legends and colorbars."""

    with gs.theme(gs.theme_spec("minimal", base_size=10)):
        figure, axes = plt.subplots(
            1,
            2,
            figsize=(11, 4.5),
            dpi=120,
            layout="constrained",
        )

    periods = np.arange(1, 9)
    series = ("North", "South")
    centers = (
        np.array([1.2, 1.5, 1.7, 2.0, 2.3, 2.5, 2.8, 3.2]),
        np.array([1.0, 1.3, 1.55, 1.75, 2.0, 2.25, 2.45, 2.7]),
    )
    interval = pd.DataFrame(
        {
            "period": np.tile(periods, len(series)),
            "estimate": np.concatenate(centers),
            "low": np.concatenate([center - 0.18 for center in centers]),
            "high": np.concatenate([center + 0.18 for center in centers]),
            "region": np.repeat(series, len(periods)),
        }
    )
    left = axes[0]
    gs.ribbon(
        interval,
        x="period",
        lower="low",
        upper="high",
        color="region",
        alpha=0.14,
        ax=left,
    )
    gs.line(
        interval,
        x="period",
        y="estimate",
        color="region",
        linestyle="region",
        style={"linewidth": 1.8},
        ax=left,
    )
    gs.points(
        interval,
        x="period",
        y="estimate",
        color="region",
        style={"size": 25, "edgecolor": "white", "linewidth": 0.5},
        ax=left,
    )
    gs.guides(left)
    gs.finish(
        left,
        title="Shared discrete semantics",
        subtitle="Line, points, and ribbon train one mapping",
        x=gs.axis(title="Quarter"),
        y=gs.axis(title="Estimate"),
    )

    rng = np.random.default_rng(20260915)
    score = np.linspace(0, 100, 80)
    response = 0.45 * score + rng.normal(0, 7, len(score))
    observations = pd.DataFrame(
        {"score": score, "response": response, "confidence": score / 100}
    )
    right = axes[1]
    gs.points(
        observations,
        x="score",
        y="response",
        color="confidence",
        style={"size": 34, "alpha": 0.85, "edgecolor": "none"},
        ax=right,
    )
    gs.guides(right)
    gs.finish(
        right,
        title="Continuous semantic color",
        subtitle="A trained scale produces a native colorbar",
        x=gs.axis(title="Input score"),
        y=gs.axis(title="Response"),
    )
    return figure


def render(output_directory: Path) -> tuple[Path, ...]:
    """Render the semantic gallery into an existing output directory."""

    destination = output_directory / "semantic_gallery.png"
    figure = semantic_figure()
    try:
        gs.save(
            figure,
            destination,
            width=11,
            height=4.5,
            dpi=120,
            bbox="standard",
            metadata={"Creator": "ggstyle v0.5 semantic gallery"},
            overwrite=True,
        )
    finally:
        plt.close(figure)
    return (destination,)


def main() -> None:
    """Render the gallery beside this script or into an explicit directory."""

    parser = argparse.ArgumentParser(description=__doc__)
    parser.add_argument("--output-dir", type=Path, default=Path(__file__).parent)
    arguments = parser.parse_args()
    for path in render(arguments.output_dir):
        print(path)


if __name__ == "__main__":
    main()